Excel Easy

Introduction
Excel beginner? No problem—you’re in the right place. Everyone starts as a rookie. That’s why we created this guide to help you understand all the Excel functions that you need to know and show you all the powerful features Excel has to offer for data analysis. In other words, by the end of this guide, you won’t just be an Excel rookie; you’ll have become an Excel master!
We know that getting started can be daunting, so we wrote this guide with a purpose: to remove any complexity and make your journey into learning Excel easier and more successful. From formatting spreadsheets to using formulas, we will cover everything step-by-step in simple language so that anyone can learn how to use Excel like a pro. So, let’s get started!

Getting Started With Excel Basics
Getting started with Excel doesn’t have to be daunting. By familiarizing yourself with just a few basic concepts, you can begin to unlock the power of Excel and use it to take your data analysis to the next level.
Let’s start with the basics: Functions. A function is a formula that takes values, inputs them into an equation and returns a single result. They can vastly reduce the time you spend on repetitive tasks by automating calculations and data manipulation.
The syntax for functions is simple – it always begins with an equal sign (=) followed by the name of the function, then parentheses containing any necessary arguments. After entering the formula in a cell and pressing enter, Excel will calculate your result based on whatever arguments you gave it.
Now that you know about functions, let’s talk about some of Excel’s powerful capabilities for data analysis. With built-in charting tools, pivot tables and conditional formatting options, working with data in Excel has never been easier or more enjoyable!
Working With Data in Excel
Ready to start crunching the numbers? Excel makes it easy to analyze, view and share data. With its powerful features, you can get more out of your data than ever before.
Let’s start with Functions. Functions are specialized formulas that can help you calculate quickly and easily. They do the work for you so that all you have to do is enter the formula into the cell, press enter, and your result appears! Looking for a particular calculation? Just type ‘=’, followed by the function name—for example, =Sum or =Average—and Excel will fill in the rest of the equation for you.
Next up is formatting. You can customize your data with formatting options like colors, fonts and data bars to get your point across even faster. You can also use filters to organize your data and find exactly what you’re looking for in seconds. It’s great for organizing large amounts of data or easily tracking patterns or trends in your numbers.
Ready to take it one step further? Excel also has advanced features like pivot tables and conditional formatting to give you deeper insights into your data so that you’re always one step ahead!
Exploring Excel Functions
You may have heard the term “Excel function” before. What is an Excel function? Functions in Excel can help you analyze data quickly and efficiently. Excel functions are basically formulas that can do a variety of math operations such as sum, average, count, min and max.
Using Excel Functions
Using functions in Excel is relatively easy—all you need to do is type an equal sign = and then the name of your desired function. Then, to make it effective, you’ll provide the argument for that function by inserting the cell range you want to operate on. For example: =SUM(B3:B13).
When it comes to exploring different functions in Excel, there are a few different categories:
Statistical/Math Functions
Text Functions
Date & Time Functions
Logical Functions
Database Functions
Information Functions
Financial Functions
Lookup & Reference Function
By learning these different categories of functions, you can start to understand how to work with data in more complex ways. It’s amazing how much your spreadsheets can do when you add in a few simple functions!
Using Excel for Visualizations
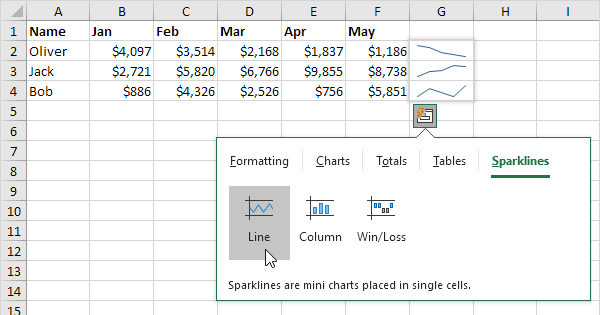
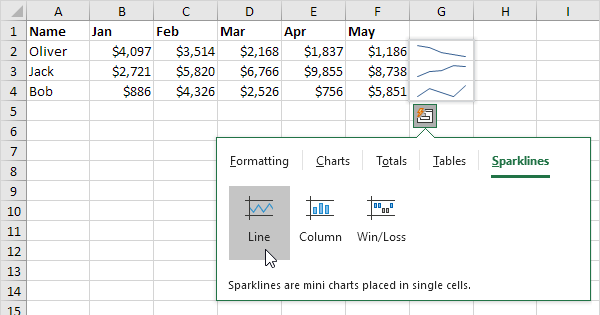
Excel isn’t just for complex calculations—it’s also a great tool for creating visualizations of your data. You can make all kinds of graphs, charts, and illustrations to bring life to your data and add power to your presentations.
Bar Chart
Bar charts are one of the most common ways to visualize data in Excel. They’re used to compare different variables or groups, and display them in an easy-to-understand format.
Select the data you want to include
Select the desired chart type
Click Insert
Customize your chart
Line Graphs
Line graphs are a great way to track changes over time and show trends within your data.
Select the desired chart type
Click Insert
Customize your chart
Visualizing your data makes it easier for everyone involved in a project or presentation to understand what’s going on—so why not take advantage of the power that Excel has available? With just a few clicks you’ll have dynamic visuals that will make everyone sit up and pay attention!
Managing Workbooks in Excel
When using Excel, it’s important to understand how to manage your workbooks. This can come in handy if you need to create multiple sheets or rearrange existing ones.
The great news is that Excel makes it easy for you to manage your workbooks! Here’s a few things you can do:
Create Multiple Sheets
On the bottom of the worksheet tab bar, there’s a plus icon which you can use to create multiple sheets in the same workbook. Once you’ve added additional sheets, you can name them and drag them up and down the list to arrange them in whatever order is most convenient for you.
View Multiple Sheets at Once
You can also view multiple sheets at once side-by-side, which is especially helpful if you want to compare two different sheets. To do this, start by selecting View > New Window from the Ribbon menu. Now, both windows will display your workbook and make it easier for you to keep your eye on both windows as you make changes across sheets.
Merge Sheets Together
In addition, if you want to merge two or more of your worksheets together into one sheet, Excel makes it quick and easy. Just select Insert > Table > Merge Tables from the Ribbon menu and follow the instructions in the pop-up window. Then, Excel will automatically combine all of your selected sheets into one new sheet that’s easy to read and analyze!
Analyzing Data With Advanced Features
If you’re a data analysis beginner, Excel is the perfect place to start. It’s packed with powerful features that can help you analyze data and make decisions quickly and easily. From sorting and filtering to creating charts and pivot tables, Excel can help you get the most out of your data.
Sorting and Filtering: Sorting and filtering allow you to quickly find the exact data you need without having to scroll through pages of raw data. You can sort by columns or groups of columns, as well as use filters to limit the amount of data that appears.
Charts: You can create beautiful visual representations of your data using Excel’s chart feature. Choose from line, bar, pie, or other chart types to display your data in clear and colorful ways.
Pivot Tables: Pivot tables are Excel’s powerful tool for transforming large sets of raw data into meaningful insights in seconds. With just a few clicks, you can group, summarize, compare, calculate percentages and more with your existing information.
By taking advantage of these powerful features in Excel, you’ll be able to quickly understand your data—and use it make better decisions faster than ever before!
Conclusion
Excel Easy is a great way to get your feet wet with the powerful features and functions Excel has to offer. It allows you to take your data analysis skills to the next level and offers you a comprehensive introduction to the world of Excel, from the basics to more advanced features.
Whether you’re a beginner, an intermediate, or an expert, Excel Easy can help you become an Excel master. Start with the basics and work your way up, mastering the powerful analytical tools that Excel has to offer. With Excel Easy, you’ll be well on your way to excelling at Excel!
Contact us

Pak Address:
Johar Town H Block lahore, Pakistan
amnakhank22@gmail.com

+92 316 5544991